
This article gives you the practical knowledge you need to work with your City inventory.
Content
Structure of the City inventory
Whether it is in the process of personalising your ClimateBoard or when you are adjusting your pathway, you may want to look up and modify your City inventory.
The City inventory is your baseline year inventory, i.e. it shows the total emissions of the year your entered data is from. This is different from the Transition hierarchy, which shows your city's emissions by your set end year.
The City inventory sorts the parameters and their respective Carbon Causal Chains (CCC) according to the main and sub-categorisation of the GPC accounting and reporting standard (Greenhouse Gas Protocol for Cities, Fig. 1).
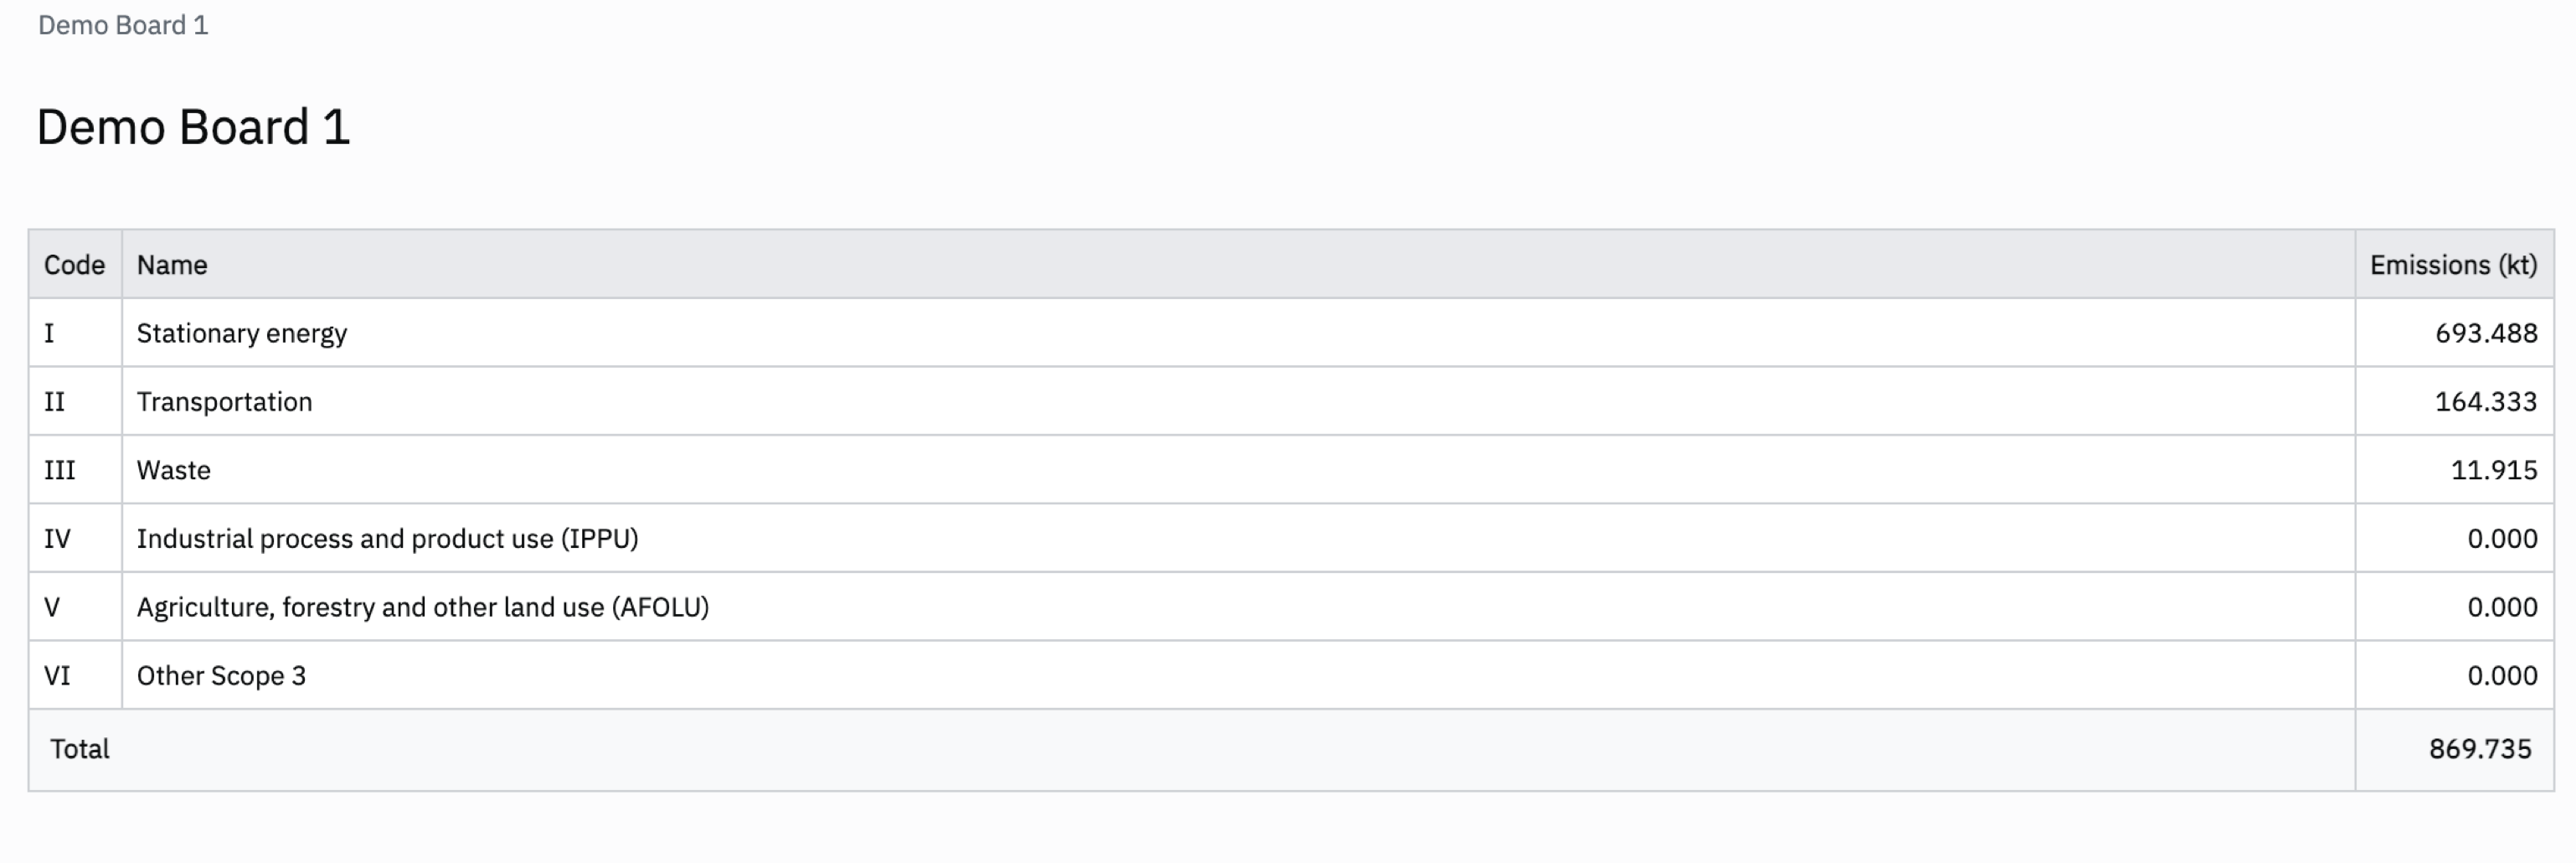
Fig. 1
In the future, you will be able to choose between different national and international protocols making it possible to work in a more familiar environment.
Not familiar with the GPC?
For more information on the GPC and its categories, please click on the following link:
Global Protocol for Community-scale Greenhouse Gas Inventories
As described in the article, Parameters classification and data sources, we distinguish between physical parameters (Operations, Energy intensities, Energy and Emission factors) that are used as variables in the Carbon Causal Chain, and socio-economic parameters (Activity assumptions, Efficiency improvement assumptions, City scaling characteristics) that describe the behaviour in your city.
In the tree menu in the City inventory you can find those types of parameters as shown in Fig. 2.
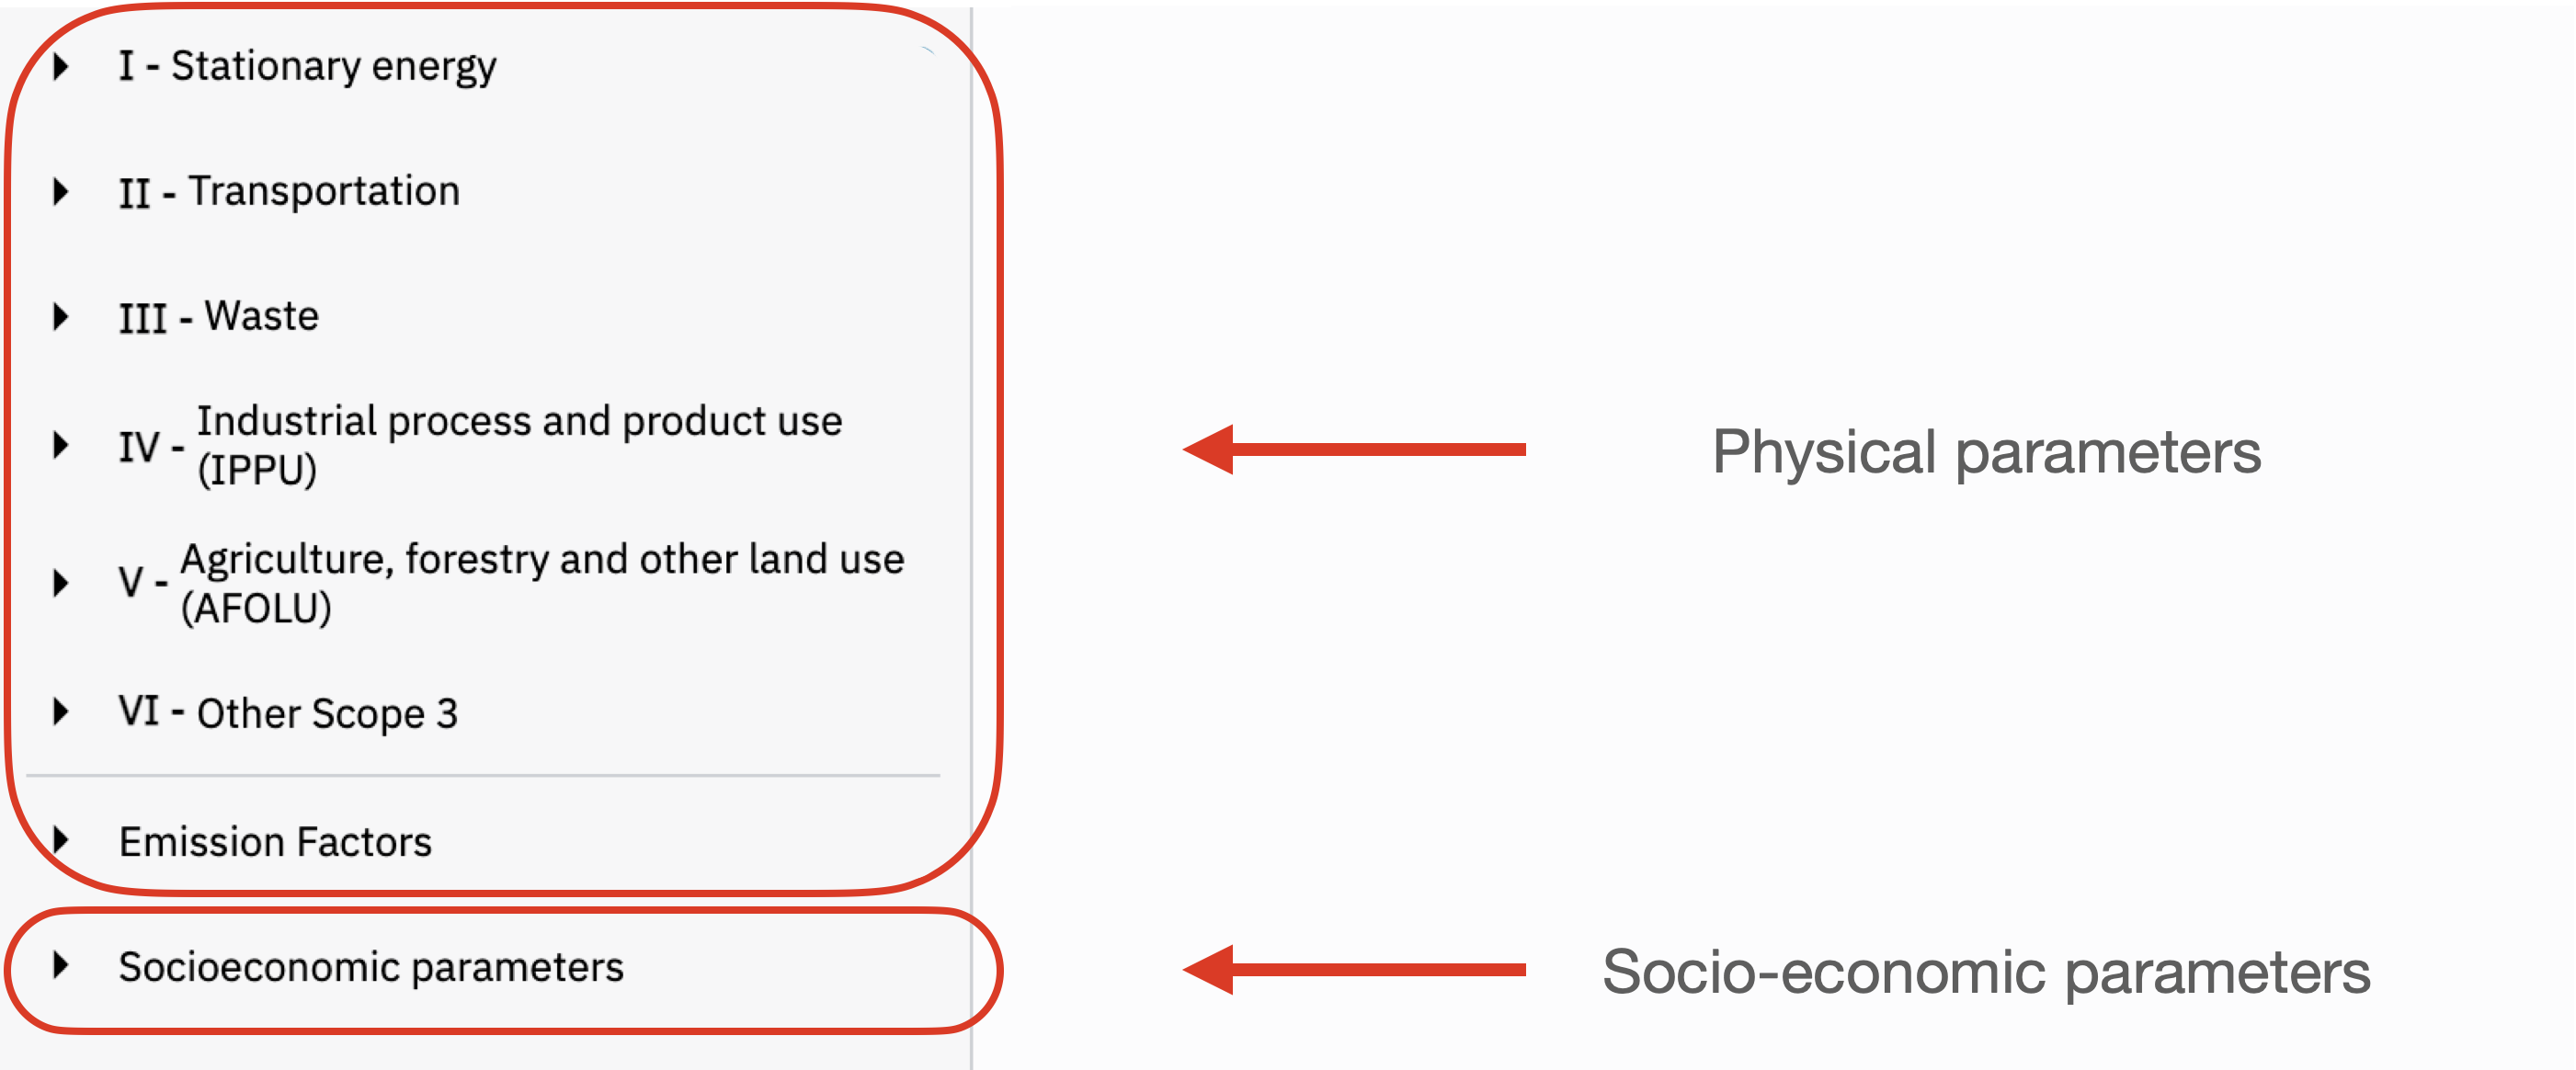
Fig. 2
On the lowest sub-level of the tree menu you will find a list of mechanisms sorted under the corresponding category together with their respective CCC. In ClimateOS we’re calculating your emissions based on the socio-economic activities that happen in your city (e.g. transporting people and goods from A to B) and the mechanisms those activities are carried out with.
In the table in Fig. 3, ClimateOS lists those mechanisms and any resulting emissions for the relevant sub-sector, in this example Personal transport.
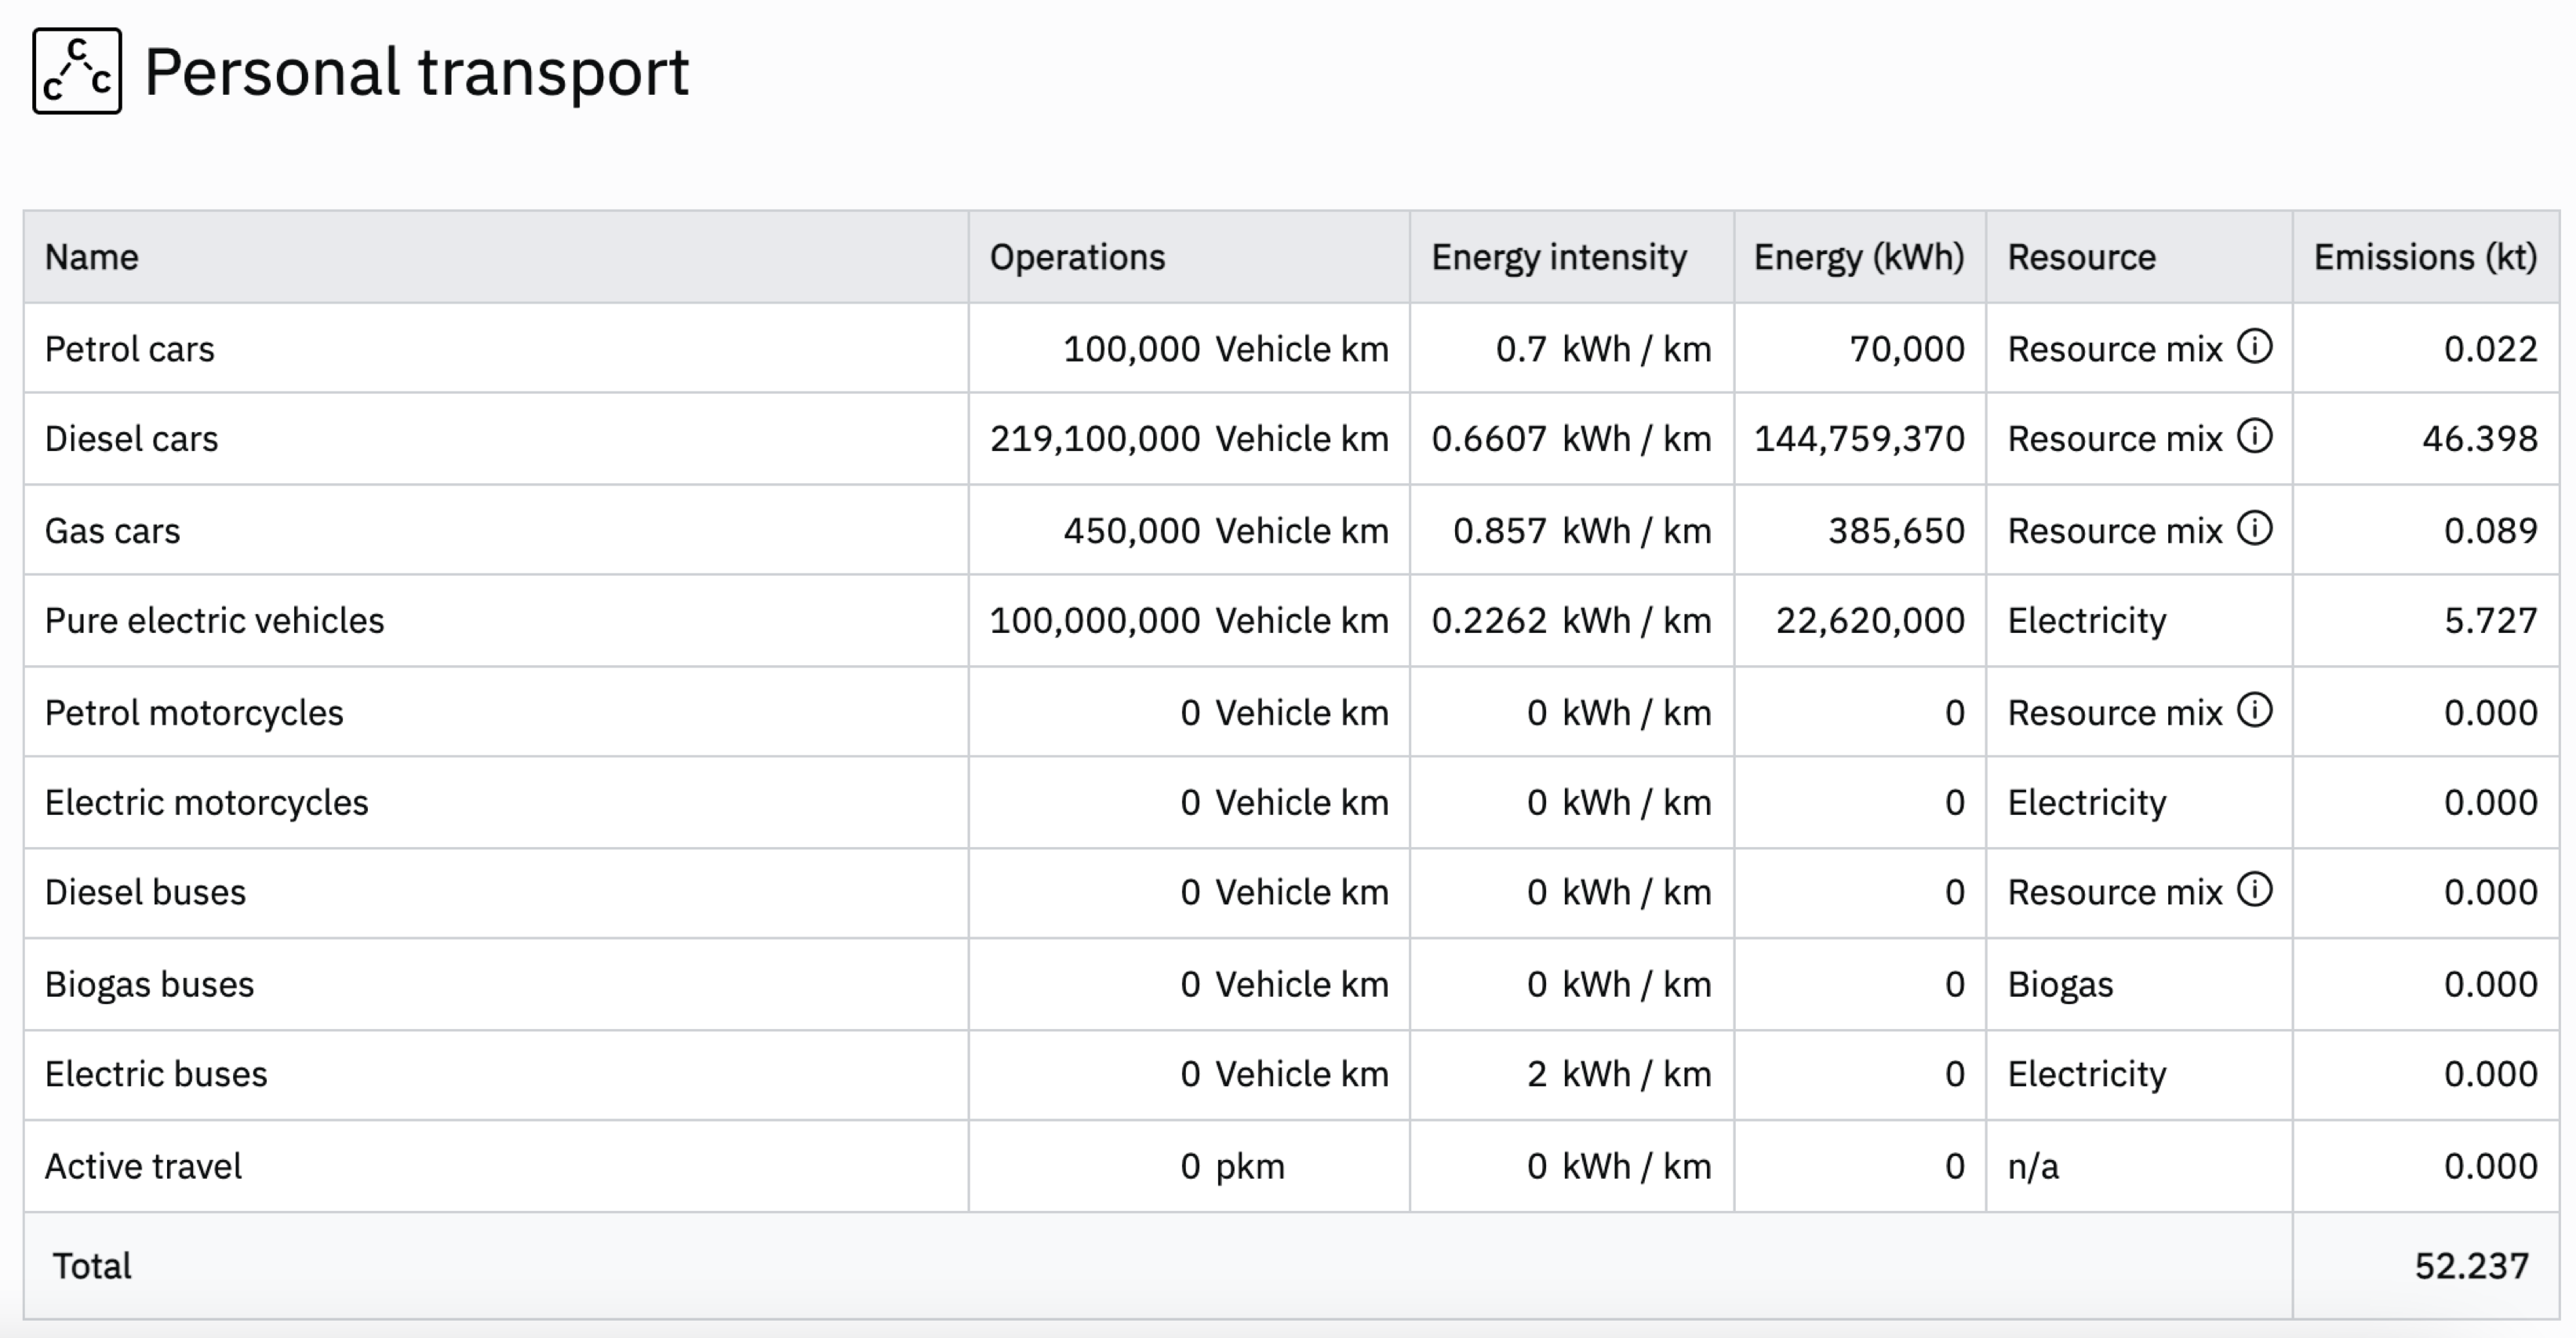
Fig. 3
Clicking on one of the listed mechanisms per category opens up the corresponding CCC as shown in Fig. 4 with the example of petrol cars. You can see the name of the mechanism, the operations, the energy intensity, the total amount of energy to carry out all the operations (operations x energy intensity), for fuels the resource mix, the emission factors as well as the resulting total greenhouse gas emissions (energy x emission factor).
Depending on the proportions of the resource mix, for example how much ethanol is mixed in the petrol, the emission factor and thus the total emissions can be reduced for this mechanism.
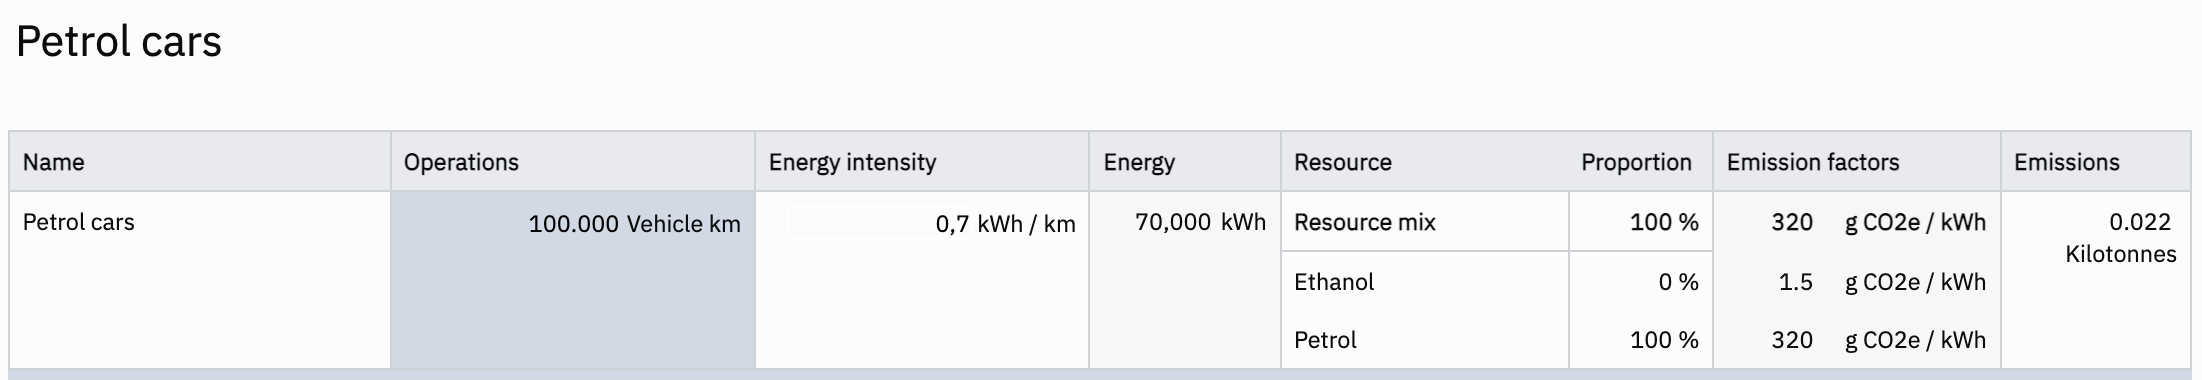
Fig. 4
Below the CCC, for each field individually, you can find the tabs Log & Reference, Scaling (only for Operations) and Estimates. The Log & Reference tab logs all the changes you're doing to a particular field in the CCC as well as allows you to enter your own comments through the text box on the left hand-side. On the right hand-side you can find the reference for the estimated value that we used when spinning up the ClimateBoard (Fig. 5).
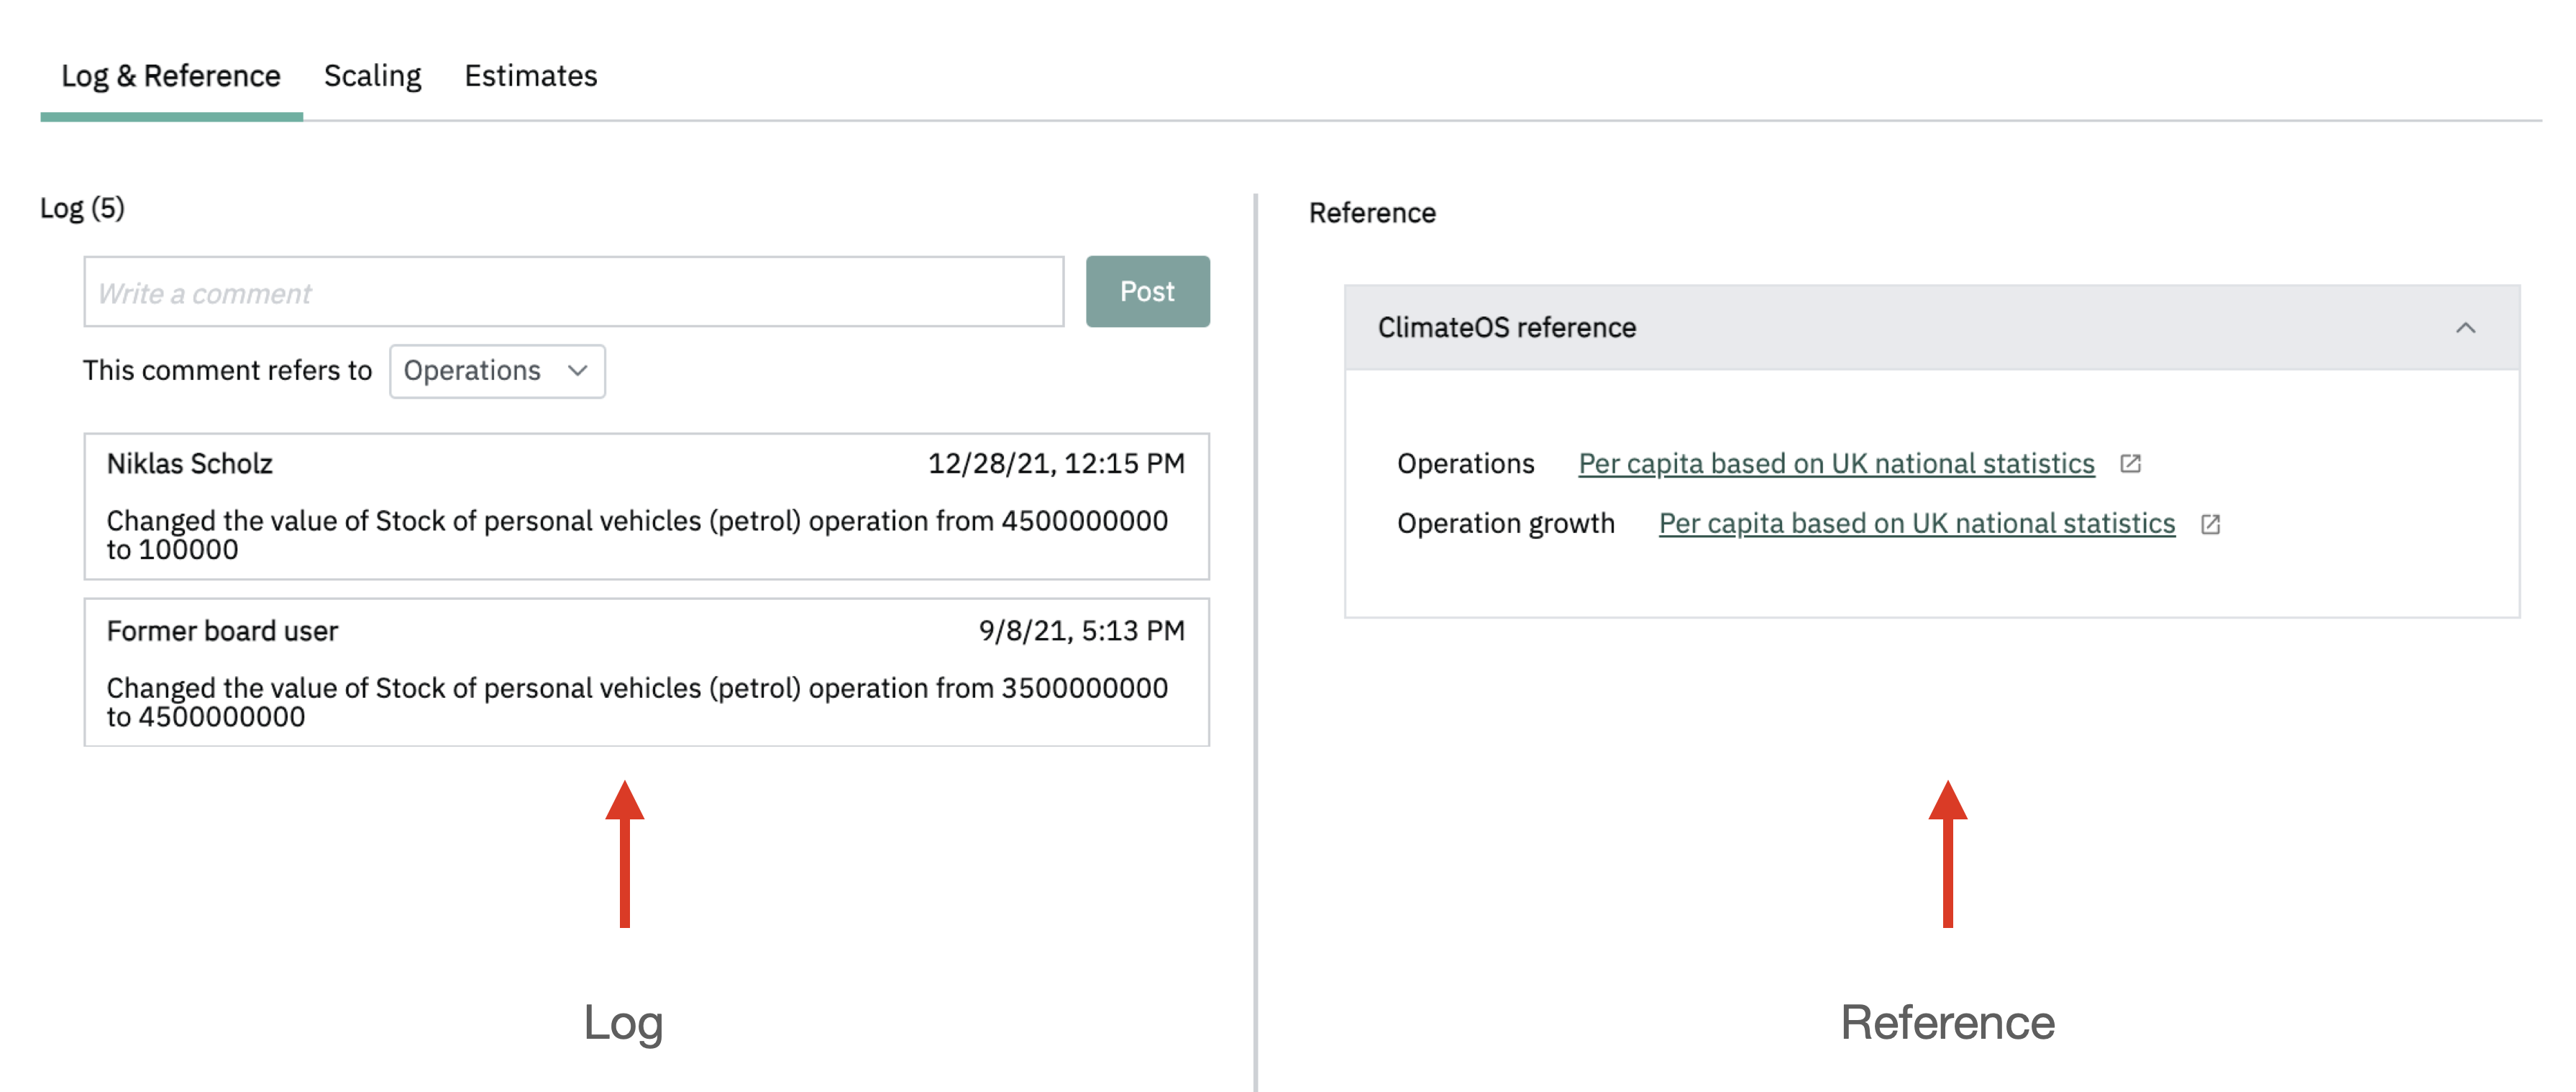
Fig. 5
Estimated values
The estimated values show the values that were entered at the time of the spin-up of your board. They are either based on national statistics and scientific studies, or are calculations based on such numbers. For more information, please refer to Parameters classification and data sources.
The estimated values are there for reference, they are not used in any calculations. They are a guide, and the best available data for where you do not hold local information.
When you hover over the symbol next to the estimated value, a comment about its source is displayed. If you click it, you will be directed to an external source in which we indicate the sources we used as well as the assumptions or calculations we made to get to the value.
Some estimated values are dependent on the city's population. If the city's population changes, the estimated values will be recalculated accordingly.
Scaling allows you to see and alter the yearly growth of the operations (see Fig. 6). Therefore, this tab is only visible when the operations are selected in the CCC.
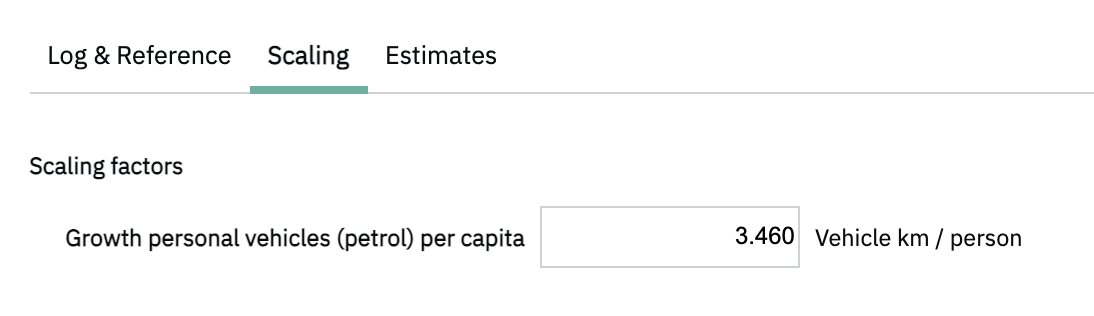
Fig. 6
Scaling parameters
When looking at the reference scenario emissions for your city, if all other parameters remained the same, the emissions from any given activity would be determined by the size of the stock of operations. The year-to-year differences in emissions are then determined by the growth of this stock.
Currently, we model that growth using a simple linear population-indexed approach. You can set the population growth in your baseline settings, and when combined with your total population, an absolute number of persons being added to the city each year is calculated. From this, we can multiply the number of persons in the population growth, with stocks expressed on a per-capita basis.
Let’s assume in a city, battery electric vehicles (BEV) together drive a total distance of 100 million vehicle km in a baseline year.
Example A where the stock of operations and growth rate are both modelled from a per capita data set:
Our city has a population of 400,000 and a population growth rate of 0.2%, which gives you a population increase of 800 people in that year (400,000 x 0.2%). We can then multiply this number by our expected growth rate for battery electric vehicles, which is 250 vehicle km/per capita (in this example, based upon the total distance driven by battery electric vehicles divided by population: 100 million/400,000). This then gives us a figure of 200,000 (250 vehicle km x 800 people) extra vehicle km for BEV that year, and a new total stock of 100,200,000 vehicle km.
Example B where actual data or other modelled data is used where the stock and growth rate are not solely linked by population:
Our city has a population of 400,000 and a population growth rate of 0.2%, which gives you a population increase of 800 people in that year (400,000 x 0.2%). We can then multiply this number by our new expected growth rate for battery electric vehicles of 1000 vehicle km /per capita (which comes from some local or national research, for example). This then gives us a figure of 800,000 (1,000 vehicle km x 800 people) extra vehicle km for BEV that year, and a new total stock of 100,800,000 vehicle km. This is an overall growth rate of 0.8% (800,000 / 100 million x 100).
These are the Scaling parameters seen under Operations in the CCC, and the estimates we provide are usually calculated from national level datasets for the most recent year divided by population to be appropriate for your region. This provides an estimate of how much those operations will grow in your city, per year, on average. It can be used in case local data is missing.
If you have historical data for any of the stock parameters available, so that you can see the historical development over time, you can extrapolate the increase per year and enter that figure as the growth parameter for the years until your goal year.
Currently it’s not possible to input negative values for any of the scaling parameters, but this is under review for future development, along with other growth parameters for cities with low or no population growth, and for operations that have changes independent of additional population.
The Estimates tab shows you the estimated values that were used when spinning up the ClimateBoard for your city as well as their reference. You also have the option to copy them into the CCC by clicking on Copy estimate to current value (Fig. 7).
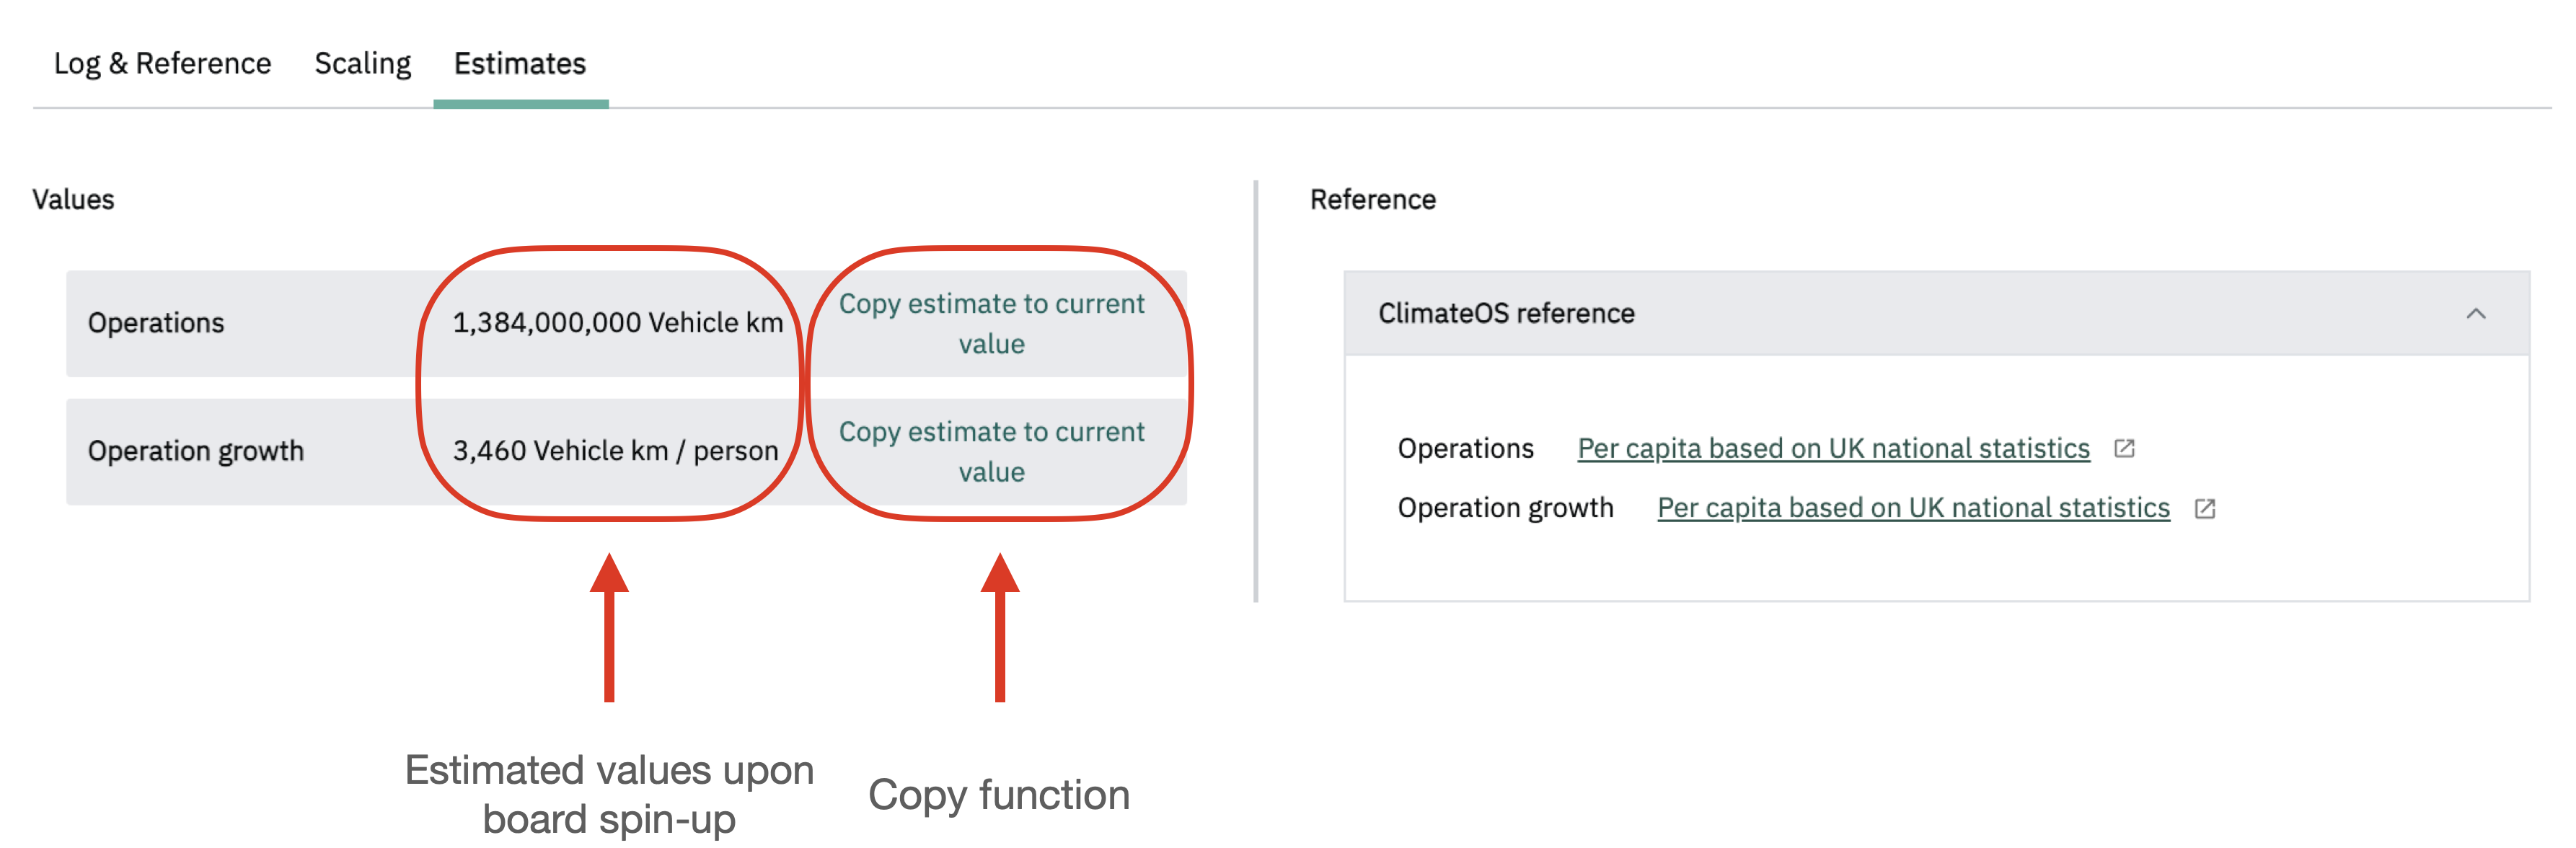
Fig. 7
Changing values
In order to change values, click on the field in the CCC for which you want to change the value. Now you can manually change the value (Fig. 8). Once you've changed the value and pressed the Enter button on your keyboard or clicked somewhere outside the field, the value is saved.
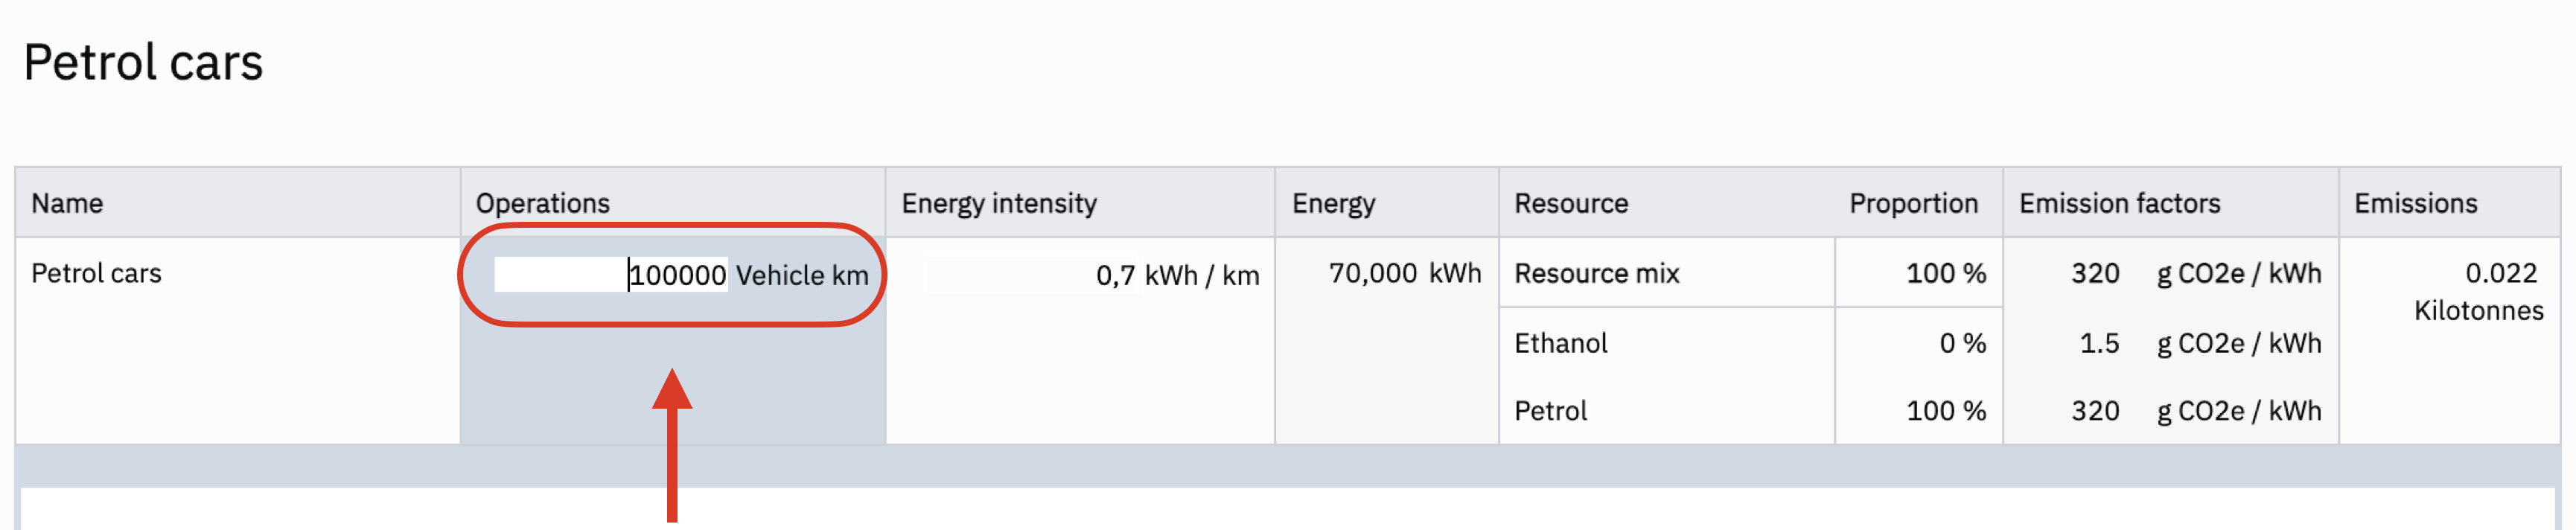
Fig. 8
In case you want to change the resource mix (for fuels), click on the corresponding field in the CCC, enter the proportions of the resource into the provided fields in percentage and click on Save. Note, that the proportion between resources can't exceed 100% (see Fig. 9).
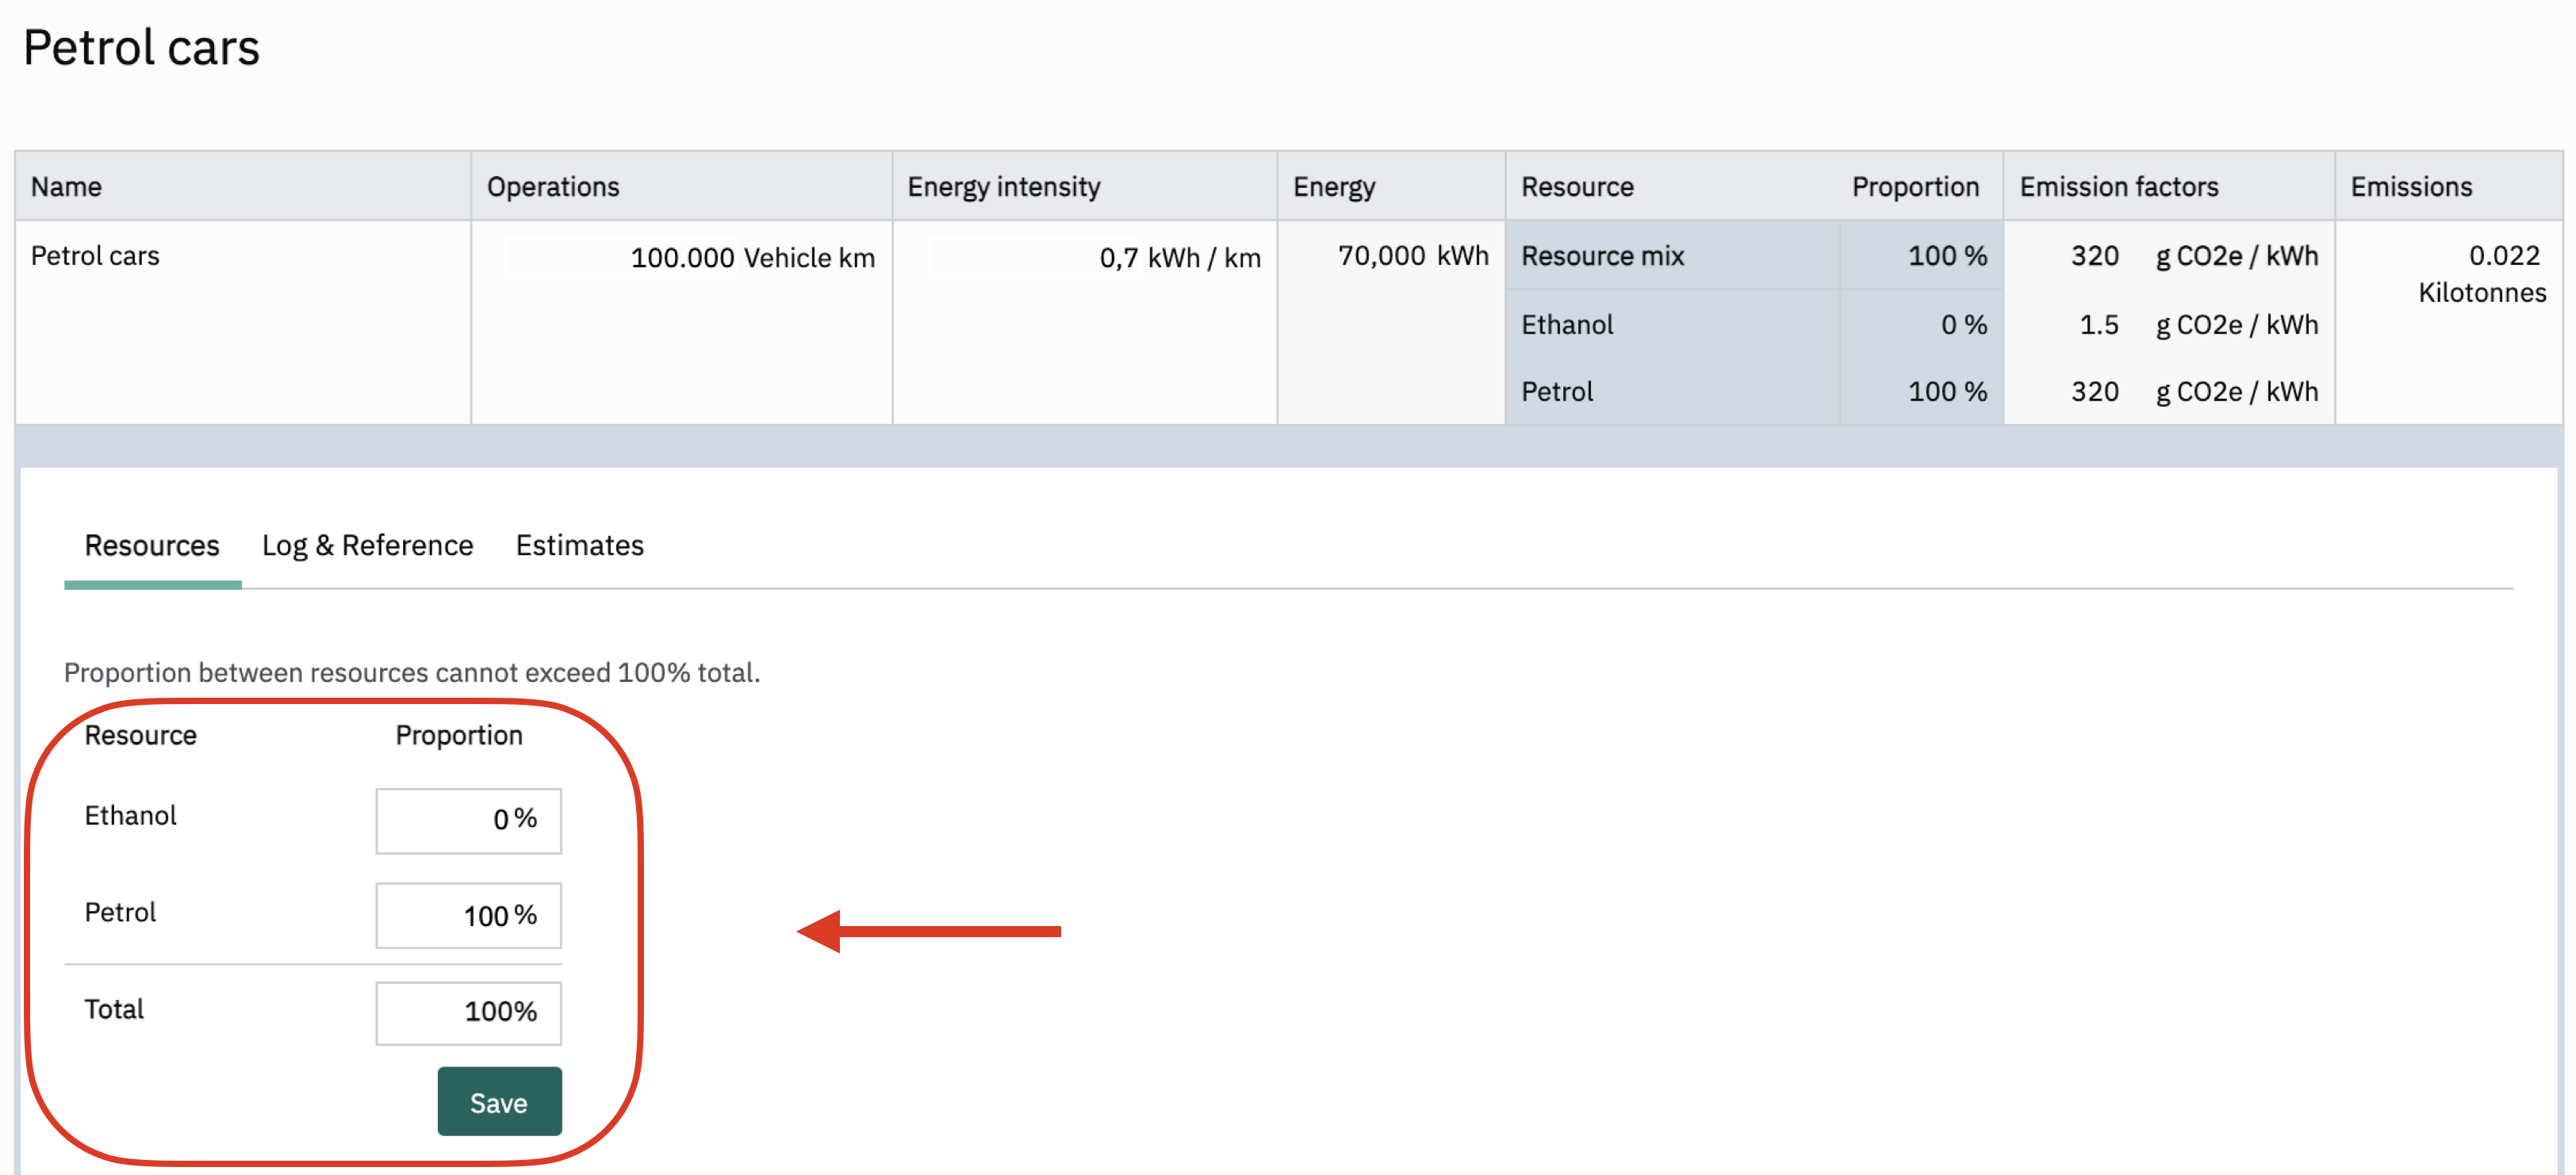
Fig. 9
In case you want to leave a comment about where the value is coming from, how you calculated it or simply provide more information, you can do so, by using the comment function in the log. Just type in your comment and click on Post.
Find a list of recommended parameters to change first in order to quickly make your ClimateBoard mirror your municipality here.
New parameters and Carbon Causal Chains
Sometimes new parameters and CCCs appear in the board. This usually happens once a new Transition element is made available which requires new parameters or CCCs. The new parameters are populated with a default value based on the global estimated values. You can go into your City inventory, review the new parameters and if applicable change them to a local value.
All the new parameters are clearly marked with a blue circle next to the categories as well as the sub-categories, leading you to the exact location of the new parameters (see Fig. 10 and 11).
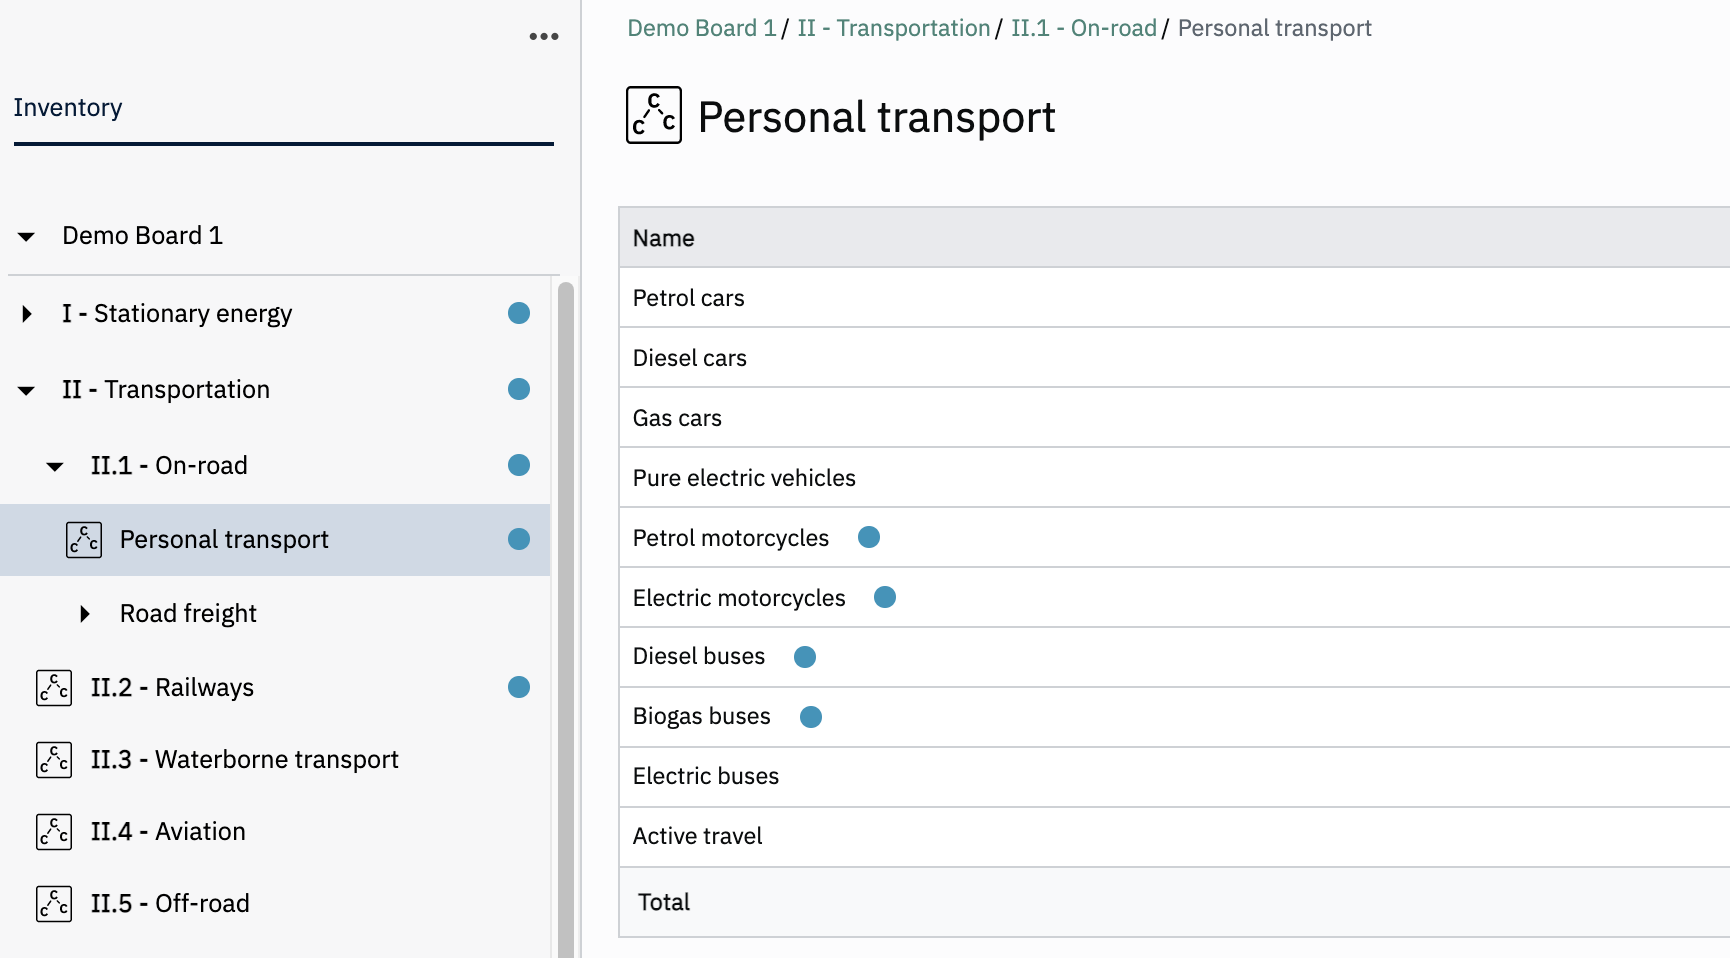
Fig. 10
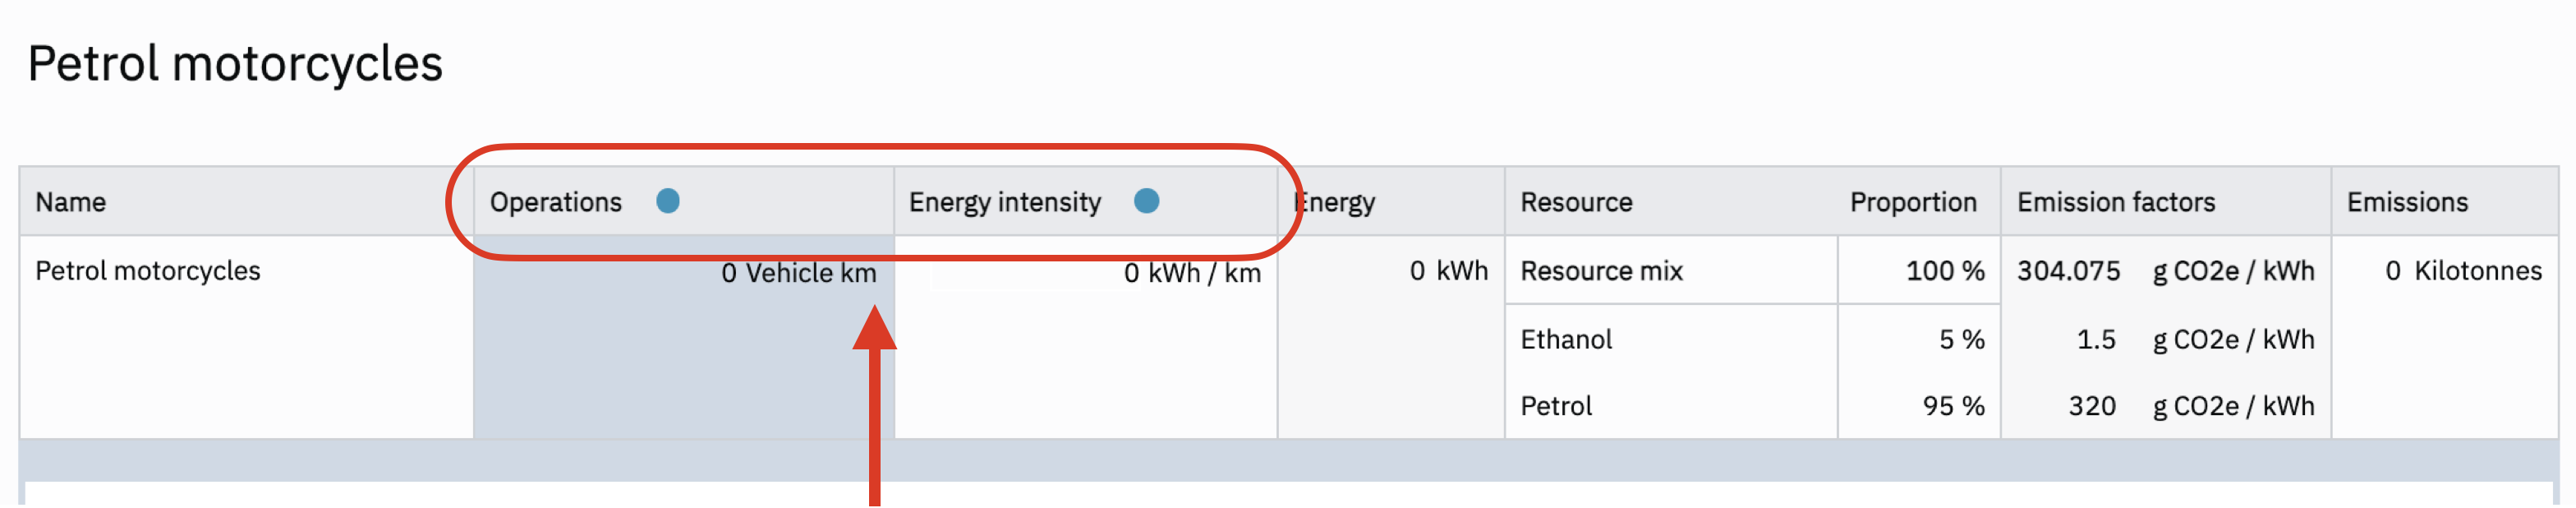
Fig. 11
In case you have local data for the new parameters available, please change the values accordingly. Otherwise we recommend copying the values you find in the Estimated tab below the Carbon Causal Chain.