
Learn about the different kinds of parameters we use in ClimateView and where the data is coming from.
Content
Documentation and transparency
Physical parameters
This part of the article is a continuation of the article on Carbon Causal Chains, the way we calculate emissions from the bottom-up.
Recap: Carbon Causal Chain
A Carbon Causal Chain (CCC) is a logic model for the calculation of the total amount of emissions from the operations by which activities are carried out. The CCCs consist of four distinct but connected levels. These levels are classified as: activity, work, resource and emission (Fig. 1). The CCC describes the causal flow from an activity to an emission.
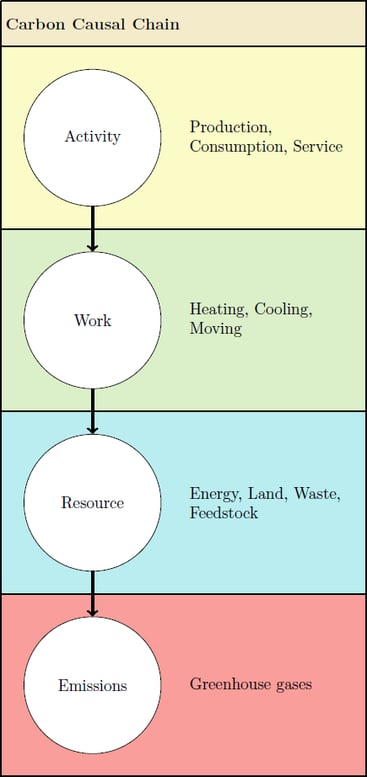
Fig. 1
The levels outlined in the CCC can be expressed as followed:
- Activity - the actual number of operations carried out with a particular mechanism and resource to satisfy a city's need (i.e. kilometres driven by petrol cars to fulfill the need to travel).
- Work - the amount of energy needed in kWh to carry out one unit of the operations with a particular mechanism and resource. This is what is called the energy intensity of the operation (i.e. the amount of kWh needed to drive one kilometre with petrol cars).
- Resource - the total amount of energy in kWh needed to carry out all the operations with a particular mechanism and resource to serve a need (i.e. the total amount of energy in kWh needed to drive all the kilometres with petrol cars that fulfill the need to travel). This is the result of multiplying the number of operations with the corresponding energy intensity for the resource used.
- Emissions - applying the correct emission factor (g CO2eq/kWh) for a particular resource to the total amount of energy needed to carry out all the operations, results in the total amount of greenhouse gas emissions coming from the activity.
Example:
In ClimateVille, petrol cars are driving 100 km per year to serve the need to travel. Here, the 100 km is the actual number of operations carried out. The mechanism used for those operations are cars which use the resource petrol to operate. In order to drive one of those 100 km with petrol cars, a certain amount of energy is needed, the energy intensity. For the sake of the example, let's assume that in order to drive one kilometre with petrol cars, 0.7 kWh are used. Multiplying the operations (100 km) with the energy intensity for petrol cars (0.7 kWh), results in the total amount of energy used to carry out all the operations (100 km x 0.7 kWh = 70 kWh). Now we can multiply to correct emission factor for the resource used (petrol: 320 g CO2eq/kWh) with the total amount of energy (70 kWh), to calculate the total amount of greenhouse gas emissions resulting from carrying out all the operations (70 kWh x 320 g CO2eq = 22400 g CO2eq or 22.4 kg CO2eq).
Operations, Energy intensity and Emission factors are therefore physical parameters, describing how things are in your city.
Sources
For the initial population of the ClimateBoard, the Operations are calculated based on the national average. The ones that depend on the city's size are calculated based on the average per capita value for the respective parameter of the specific country and then multiplied by the city's population. That way, these parameters take into account the size and demographic development of your country/region/city. These data points are a starting point for you to individualise your ClimateBoard. Click here to read more about how we spin up ClimateBoards.
The Energy intensities are taken from scientific and national studies where available. If the parameter we are looking for is not directly available, we have calculated it based on other parameters available in scientific and national studies. In rare cases, when sufficient data is not available, we may have taken values from national studies from other countries where we deem these values sufficiently similar.
The Emission factors are solely taken from scientific studies and national statistics. Some of these are very similar or even the same in every country (e.g. emission factor for diesel) whereas others differ between countries (e.g. electricity emission factors, where the resources used to produce electricity differ between countries).
Socio-economic parameters
The socio-economic parameters in ClimateOS consist of what we call Activity assumptions, Efficiency improvement assumptions and City scaling characteristics. These parameters describe the behaviour in the city
The Activity assumptions are city-specific behavioural parameters, for example the average kilometres driven for commuting purposes or the proportion of office workers in your municipality. It is a subset of the total amount of kilometres driven which defines the total potential of certain Transition elements.
The Efficiency improvements assumptions describe how far you can realistically get within particular Transition elements that are optimising the mechanism, not shifting it. Examples of such Transition elements and their stretch parameters are:
- Eco-driving - by what percentage can you decrease the energy intensity (energy consumption) when applying eco-driving to cars with combustion engines. The savings factor for eco-driving is the stretch parameter.
- Retrofitting a building - by what percentage can you decrease the energy intensity (energy consumption) for heating a building after it has been retrofitted. The savings factor for retrofitting is the stretch parameter.
The City scaling characteristics describe the most fundamental characteristics of your city, its population and population growth.
Sources
The Activity assumptions are initially populated with values from a national/regional/local statistical authority.
The values for the Efficiency improvement assumptions are calculated based on available scientific studies or national statistics for the before and after scenarios. You may want to change some of these values based on your knowledge about what is realistically achievable in your city (e.g. what types of retrofitting are doable on your specific housing stock).
The City scaling characteristics are taken from the municipality's own homepage or another reliable source. Please note that the population is the population of the start year for the ClimateBoard. So if you choose a start year prior to this year, the value in the population parameter will reflect the population of that year. You can of course change these values if you have more accurate numbers.
Documentation and transparency
For everything, from own calculations to studies and statistics we used, you can find a specific source attached to the value. This way we keep everything transparent and you can see exactly where we have taken the data from and how we calculated it.
Our estimated values remain as a reference in read-only fields next to your parameter value including a link to our sources.